Remote debugging Angular project with VS Code (Firefox)
I use Firefox as default browser for development, maybe this is not main stream because most developers used Chrome, but so many Google and Microsoft in my life, therefore I use FF.
Microsoft can not use FF as spying for users and as a result MS full destroy FF support in VS2022 and full ignores most popular browser as web developer's environment.
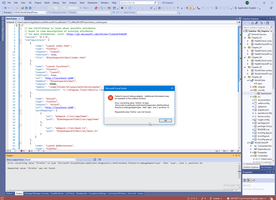
Configure FF.
To working with FF as Angular development environment we need firstly configure FF.
- Install FF install Remote control.
- Next step is configure remote debugging in FF. Usually FF use port 6000 for remote debugging, its cool, no need to change this port. Full help about debugging we can see in ling about:debugging.
- devtools.chrome.enabled
- devtools.debugger.remote-enabled
- devtools.debugger.prompt-connection
- This is not exactly related to debugging with VS Code, but we always need this component to FF - https://angular.io/guide/devtools.
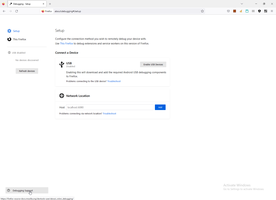
But in practice is enough 3 setting for FF (about:config)
First two parameters can setting in DevTools.
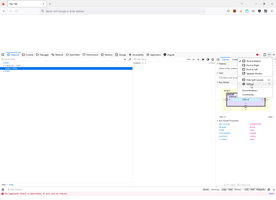
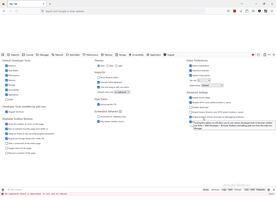
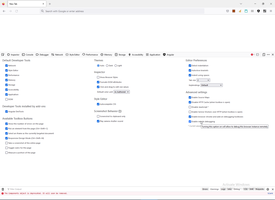
And last parameter can set by command line.
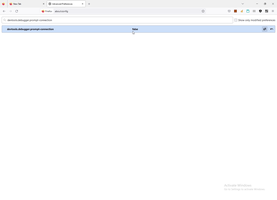
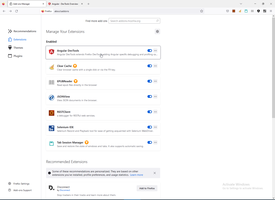
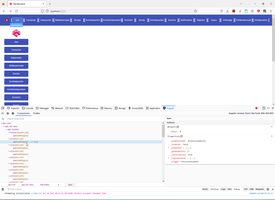
Thats it about configuring FF. If debugger don't working best practice start FF before debugging by command line.
#C:\Program Files\Mozilla Firefox\firefox.exe -start-debugger-server=6000
But is's not need, because we will configure VS Code to always use this parameters to start FF.
Configure VS Code.
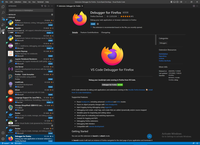
- First step is install extension to VS Code https://marketplace.visualstudio.com/items?itemName=firefox-devtools.vscode-firefox-debug.
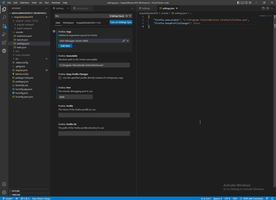
- Second step we need to set FF executable path and remote port to VS Code. But firstly we need to understand that VS Code ha3 3 levels of setting User-Workspace-Folder.
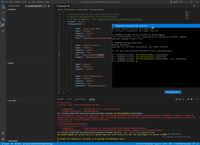
- Last step is configure launch.json - what exactly we doing in debug tab. In this file we bind always - angular developer port, FF executable with parameters, mapping folder to URL and other parameters.
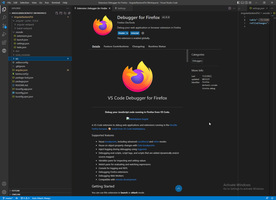
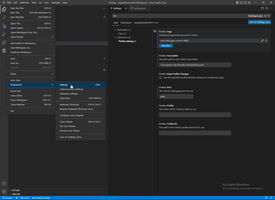
Than setting FF executable and remote port.
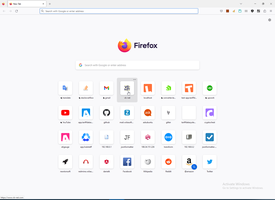
keepProfileChanges important parameter, usually you have opened many windows, this parameter allow us simple check is request from this browser exemplar allow bind to break point in VS Code or don't allow. For example, if I click new tab in my FF I see this screen - this means browser debugger server unbind from VS Code debugger.
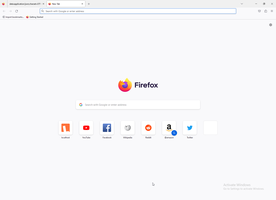
However If I see screen below this means browser debugger server connected to VS Code debugger.
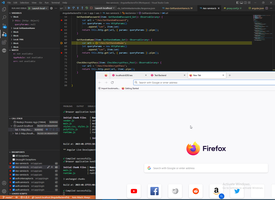
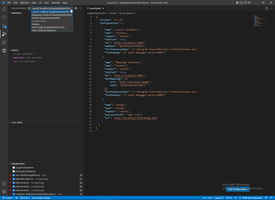

If all six step was done correctly we can avoid warning to connect debugger, warning about can not found FF,
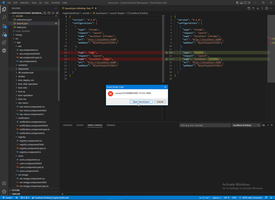
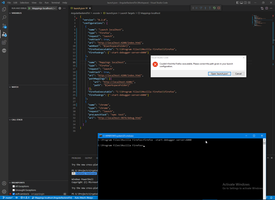
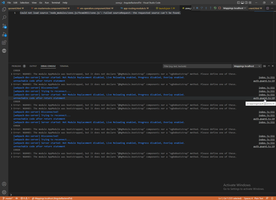
We can see debug console in VS code instead FF. And, of course, we can make all operation and set breakpoint not only in small resticted window of FF DevTools but in full screen on VS Code.
JS project context:
Front context:
Angular context:
Browser context:
 )
)
|
|