Using Page Inspector in ASP.NET MVC
by Tim Ammann
Page Inspector in Visual Studio 2012 is a web development tool with an integrated browser. Select any element in the integrated browser, and Page Inspector instantly highlights the element’s source and CSS. You can browse any MVC view, quickly find the sources of rendered markup, and use browser tools right within the Visual Studio environment.
This tutorial shows how to enable Inspection Mode, and then quickly locate and edit markup and CSS within your web project. The tutorial uses an MVC Project, but you can also use Page Inspector for Web Forms and other ASP.NET applications.
The tutorial has the following sections:
- Prerequisites
- Create a Web Application
- Use Page Inspector to Browse to a View
- Enable Inspection Mode
- Use Page Inspector to Make Changes to Markup
- Inspection Mode and the HTML Window
- Preview CSS Changes in the Styles window
- CSS Auto Sync
- Using the CSS Color Picker
- Mapping Dynamic Page Elements to JavaScript
Prerequisites
[!NOTE] To get the latest version of Page Inspector, use Web Platform Installer to install the Windows Azure SDK for .NET 2.0.
Page Inspector is bundled with Microsoft Web Developer Tools. The latest version is 1.3. To check which version you have, run Visual Studio and select About Microsoft Visual Studio from the Help menu.
Create a Web Application
First, create a web application that you will use Page Inspector with. In Visual Studio, choose File > New Project. On the left, expand Visual C#, select Web, and then select ASP.NET MVC4 Web Application.
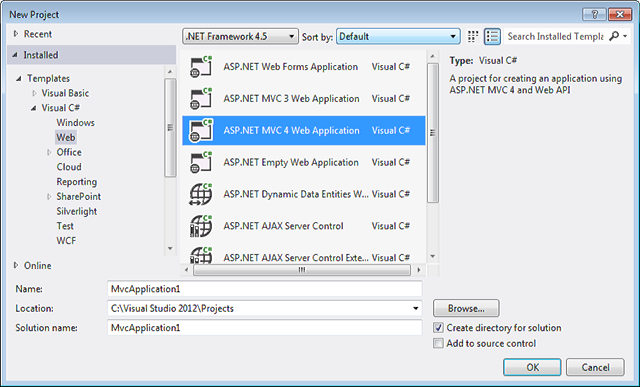
Click OK.
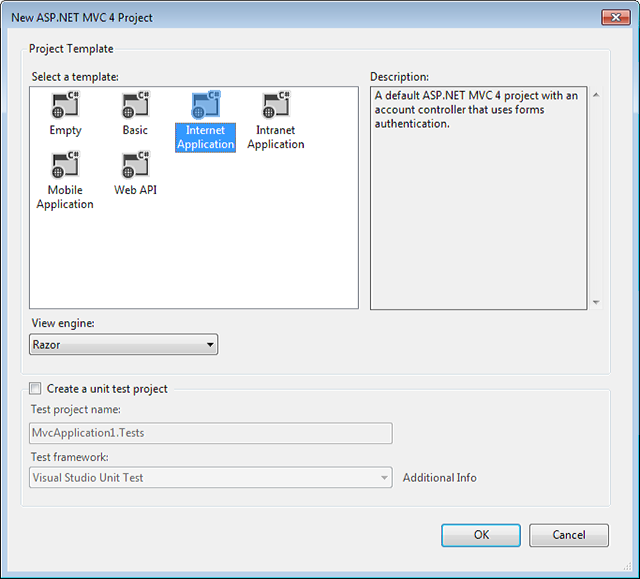
In the New ASP.NET MVC 4 Project dialog box, select Internet Application. Leave Razor as the default view engine.
The application opens in Source view.
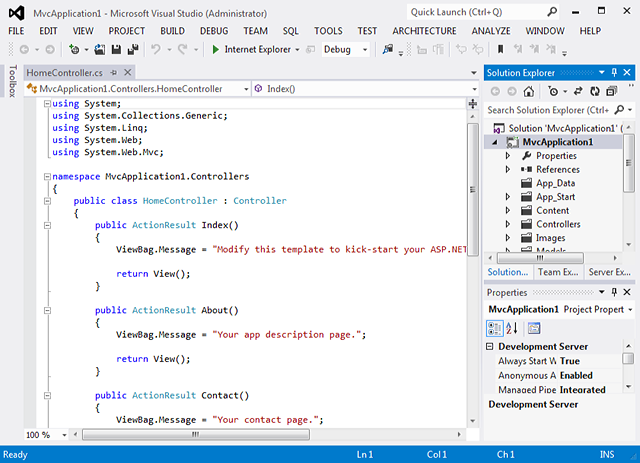
Now that you have an application to work with, you can use Page Inspector to examine and modify it.
Use Page Inspector to Browse to a View
In Visual Studio 2012, you can right-click any view in your project, select View in Page Inspector, and Page Inspector will figure out the route and display the page.
In Solution Explorer, expand the Views folder and then the Home folder. Right click the Index.cshtml file and choose View in Page Inspector.
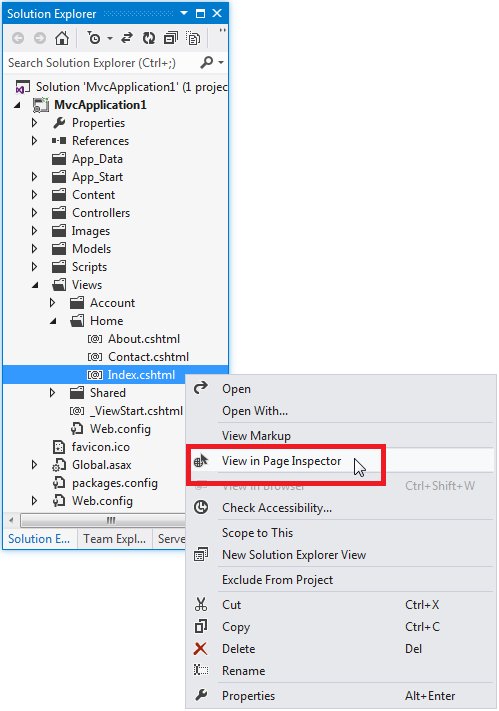
By default, Page Inspector is docked as a window on the left side of the Visual Studio environment. If you prefer, you can dock it elsewhere, or undock the window. See How to: Arrange and Dock Windows.
The top pane of the Page Inspector window shows the current page in a browser window. The bottom pane shows the page in HTML markup, along with some tabs that let you inspect different aspects of the page. The bottom pane is similar to the F12 Developer Tools in Internet Explorer.
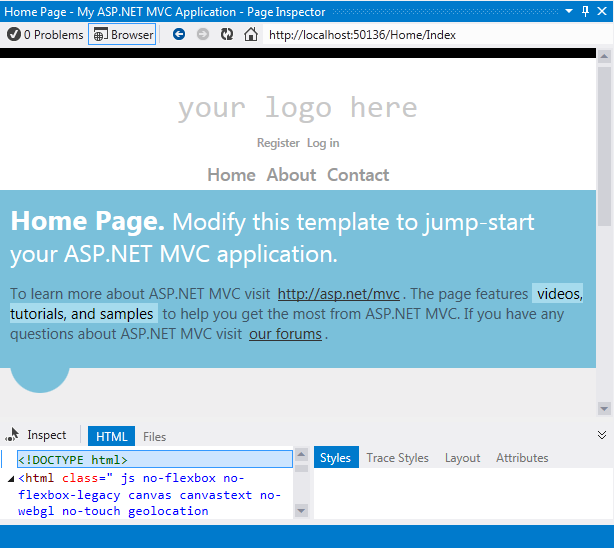
In this tutorial, you will use the HTML and Styles tabs to navigate quickly and make changes to the application.
EnableInspection Mode
To put Page Inspector into Inspection Mode, click the Inspect button. In Inspection Mode, when you hold the mouse pointer over any part of the rendered page, the corresponding source markup or code is highlighted.

Now move your mouse over different parts of the page within Page Inspector. As you do, the mouse pointer changes to a large plus sign, and the element underneath is highlighted:

As you move the mouse pointer, Visual Studio highlights the corresponding Razor syntax in the source file. If the HTML element comes from another source file, Visual Studio automatically opens the file.
In Page Inspector, the HTML tab shows the HTML that was generated from the Razor syntax. As you move the mouse pointer, the HTML elements are highlighted. The Styles tab shows the CSS rules for the element.
Use Page Inspector to Make Changes to Markup
Page Inspector lets you find markup whose location might not be obvious. Then you can modify the markup and see the resulting changes.
To see this, click Inspect and then scroll to the bottom of the page in the Page Inspector window.
When you move the mouse pointer into the footer area, Page Inspector opens the _Layout.cshtml file and highlights the section of the layout page that you have selected. As you can see, the footer are is defined in the layout file, and not the view itself.
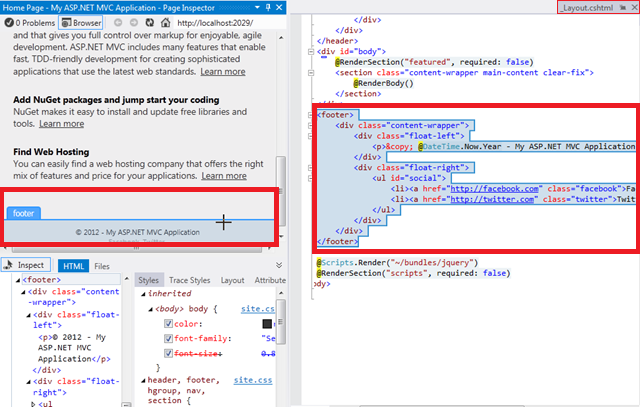
Now move your mouse pointer over the line with the copyright notice. In the _Layout.cshtml page, the corresponding line is highlighted.

Add some text to the end of the line in the _Layout.cshtml file.
<p>© @DateTime.Now.Year - My ASP.NET MVC Application Rocks!</p>
Now, press Ctrl+Alt+Enter or click the Update Bar to see the results in the Page Inspector browser window.

You might have thought that the footer defined in Index.cshtml, but it turned out to be in the _Layout.cshtml, and Page Inspector found it for you.
Inspection Mode and the HTML Window
Next, you will have a quick look at the HTML window and how it maps elements for you.
Click Inspect to put Page Inspector in Inspection Mode.
Click the top part of the page that says “Your logohere”. You are examining a particular element in more detail, so the display in the browser window no longer changes as you move the mouse pointer.
Now move the mouse pointer to the HTML window. As you move the mouse pointer, Page Inspector outlines the element within the HTML window and highlights the corresponding element in the browser window.
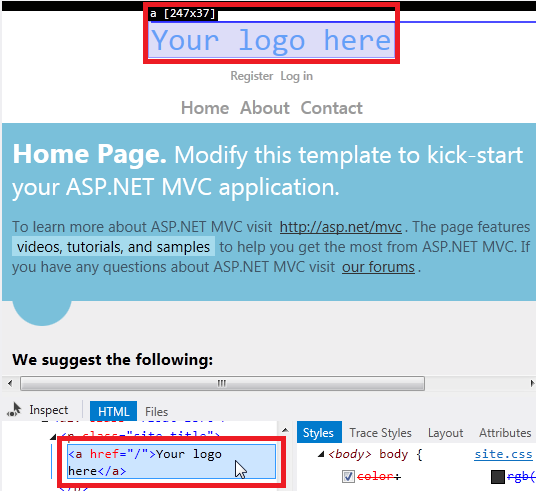
As before, Page Inspector opens the _Layout.cshtml file for you in a temporary tab. Click the _Layout.cshtml temporary tab, and the corresponding markup will be highlighted in the <header> section for you:

Preview CSS Changes in the Styles Window
Next, you will use the Page Inspector Styles window to preview changes to CSS.
Click Inspect to put Page Inspector in Inspection Mode.
In the Page Inspector browser window, move the mouse pointer over the “Home Page” section until the div.content-wrapper label appears.
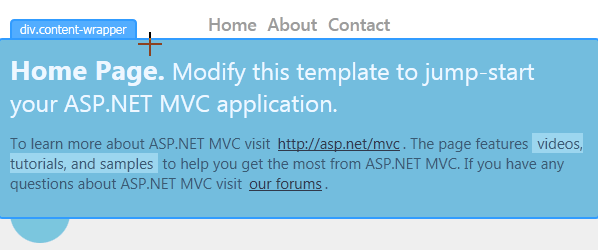
Click within the div.content-wrapper section once, and then move the mouse pointer to the Styles window. The Syles window shows all of the CSS rules for this element. Scroll down to find the .featured .content-wrapper class selector. Now clear the checkbox for the background-color property.
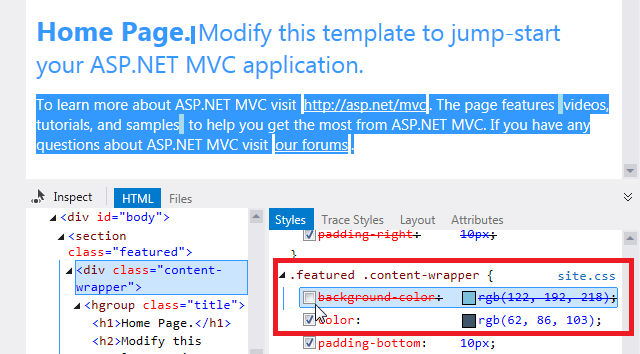
Notice how the change previews instantly in the Page Inspector browser window.
Select the checkbox again, then double-click the property value and change it to red. The change shows immediately:
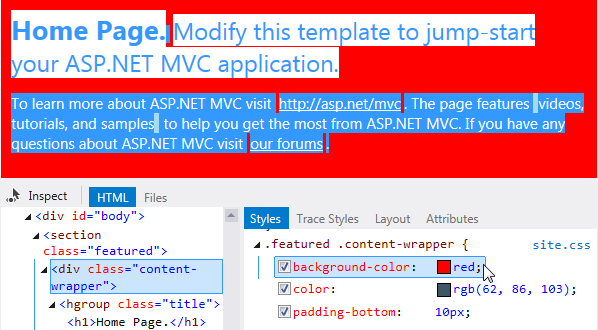
The Styles window makes it easy to test and preview CSS changes before you commit the changes to the style sheet itself.
[!NOTE] This feature requires version 1.3 of Page Inspector.
The CSS Auto-Sync feature allows you to edit a CSS file directly, and see the changes immediately in the Page Inspector browser.
Click Inspect to put Page Inspector in Inspection Mode.
In the Page Inspector browser, move the mouse pointer over the “Home Page” section until the div.content-wrapper label appears. Click once to select this element.
The Syles window shows all of the CSS rules for this element. Scroll down to find the .featured .content-wrapper class selector. Click on “.featured .content-wrapper”. Page Inspector opens the CSS file that defines this style (Site.css) and highlights the corresponding CSS style.

Now change the value for background-color to “red”. The change appears immediately in the Page Inspector browser.

The CSS editor in Visual Studio 2012 has a color picker that makes it easy to choose and insert colors. The color picker includes a standard palette of colors, supports standard color names, hash codes, RGB, RGBA, HSL, and HSLA colors, and maintains a list of the colors you’ve used most recently in the document.
In the previous section, you changed the value of the background-color property. To invoke the color picker, place the insertion point after the property name and type # or rgb(.

Click on a color to select it, or press the down arrow key and then use the left and right arrow keys to traverse the colors. When you visit a color, the corresponding hex value is previewed:

If the color bar doesn’t have the exact color you want, you can use the color picker pop-down. To open it, click the double chevron at the right end of the color bar, or press the Down Arrow once or twice on the keyboard.
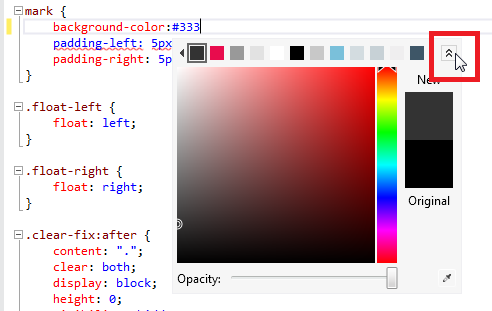
Click a color from the vertical bar on the right. This shows a gradient for that color in the main window. Choose a color directly from the vertical bar by pressing Enter, or click any point in the main window to choose with greater precision.
If there is a color on your computer screen that you want to use (it doesn’t have to be inside the Visual Studio user interface), you can capture its value by using the eyedropper tool on the lower right.
You also can change the opacity of a color by moving the slider at the bottom of the color picker. Doing so changes color values to RGBA values, because the RGBA format can represent opacity.
After you have chosen a color, press Enter, and then type a semicolon to complete the background-color entry in the Site.css file.
The Page Inspector Update Bar
Page Inspector immediately detects the change to the Site.css file and displays an alert in an update bar.

To save all your files and refresh the Page Inspector browser, press Ctrl+Alt+Enter or click the update bar. The change in the highlight color appears in the browser.
## Mapping Dynamic Page Elements to JavaScript
In modern web applications, elements in the page are often generated dynamically with JavaScript. That means there is no static markup (either HTML or Razor) that corresponds to these page elements.
With version 1.3, Page Inspector can now map items that were dynamically added to the page back to the corresponding JavaScript code. To demonstrate this feature, we’ll use the Single Page Application (SPA) template.
[!NOTE] The SPA template requires the ASP.NET and Web Tools 2012.2 update.
In Visual Studio, choose File > New Project. On the left, expand Visual C#, select Web, and then select ASP.NET MVC4 Web Application. Click OK.
In the New ASP.NET MVC 4 Project dialog, select Single Page Application.
In Solution Explorer, expand the Views folder and then the Home folder. Right click the Index.cshtml file and choose View in Page Inspector.
The first thing that is displayed in the Page Inspector browser is a login page. Click “Sign Up” and create a user name and password. Once you sign up, the application logs you in and creates a to-do list with some sample items.
Click Inspect to put Page Inspector in Inspection Mode. In the Page Inspector browser, click on one of the to-do items. Notice that instead of being highlighted in blue, the element is highlighted in orange, with “JS” next to the element name. This indicates that the element was created dynamically through script.

In addition, an orange underline appears on the Call Stack tab. This indicates that the Call Stack pane has more information about the element.
Click on the Call Stack tab. The Call Stack pane shows the call stack for the JavaScript call that created the element. Calls to external libraries such as jQuery are collapsed, so that you can easily see the calls to your application script.

To see the full stack, including calls to external libraries, you can expand the nodes labeled “External Libraries”:

If you click an item in the call stack, Visual Studio opens the code file and highlights the corresponding script.

See Also
Intro to ASP.NET MVC 4 with Visual Studio (ASP.net website)
Introducing Page Inspector (Channel 9 video)
Page Inspector Error Messages (MSDN)
 )
)
|
|